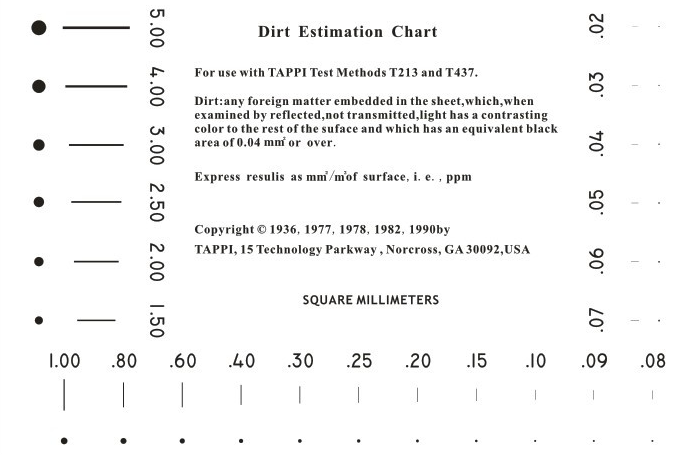
Estimation Charts are TAPPI’s most popular and reliable tools for quality control through visual inspection.

These flat, flexible charts are used to measure the size of imperfections over the range of 0.02 to 5.00 square millimeters in industrial materials.  Purchase Now:

Purchase Size Estimation Chart Purchase Dirt Estimation Chart Purchase Calibrated Size Estimation Chart

A must for medical quality inspection professionals, these charts serve as quality assurance resources to determine the size of imperfections in the following applications:

  • Measure the size of defects in products
  • Inspect third-party packaging

  • Check molded plastic products for defects                 

  • Detect embedded specs     

  • Measurement of visible ink spatter on printed surfaces

  • Estimation of the growth rate of bio-colonies

  • Detect air inclusions in transparent plastic castings and films


Size Estimation Chart (Transparent)

The TAPPI Size Estimation Chart can be used in a large number of applications where there is a  need to estimate a size (area) by way of a direct comparison to a known circular area. The dots on this chart cover the range of 0.02 to 5.00 square millimeters and are correct within an average 10% or 0.005 square millimeters, whichever is the larger. 

Instructions for use of this transparency are outlined in TAPPI Test Method T 564.

 Purchase Size Estimation Chart 


Dirt Estimation Chart
(Opaque)

DEC.png

Currently unavailable.
The Dirt Estimation Chart is the right tool to estimate the equivalent black area (EBA) of dirt or other colored specks. The round black spots on the white background of the TAPPI Dirt Estimation Chart make the same visual impression as the dirt speck on the material in which it is embedded. The opaque material of the chart is conducive for detecting any foreign matter imbedded in material which, when examined by reflected, not transmitted, light has a contrasting color to the rest of the surface.

Only the TAPPI Dirt Estimation Chart, printed on the opaque, white background can properly be used in the reflected light tests. The template for this chart is the same as the Size Estimation and Calibrate Size Estimation Charts.
Instructions for use of opaque chart is to be used with TAPPI Test Methods T 213, T 437, and T 537.

Purchase Dirt Estimation Chart

Calibrated Size Estimation Chart
(Transparent)

562901_DirtChartTransparent (3).gif

The Calibrated Size Estimation Chart (transparency) is ideal for quality assurance processes that require more exact measurement. This is the exact same transparent chart, however it has been calibrated so you no longer have to. Each chart has 23 dots that are measured within the specified tolerances, documented, and a data sheet is provided. You can feel confident knowing that each Calibrated Size Estimation Chart is within tolerance; prepared with care and precision to allow you to better serve your customers.

Instructions for use of this chart should be used in conjunction with TAPPI Test Method T 564.

Purchase Calibrated Size Estimation Chart  


More about the TAPPI Charts

TAPPI Charts were developed to work in conjunction with technical Standards developed for the detection of defects in paper and pulp and are now widely used as visual inspection tools by the medical industry.

As an ANSI-Certified Standards development organization, TAPPI’s peer-reviewed Standards ensure that products meet industry recognized best practices. Our Standards not only demonstrate how to maximize performance, they provide new ideas and operational methods to improve production. Our members and volunteers drive the development of the Standards and TIPs that are used around the world.

Contact TAPPI with product questions or to initiate Supplier/Vendor Approval Process.